While I do not think it is possible to automate your flowchart creation completely, it should be possible to improve the process nonetheless.
First off, let us improve your properties mapper configurations.
- Create an empty document.
- Create a custom property for nodes of type "Text" and call it "Node Type" (see "Edit" -> "Manage Custom Properties").
- Create five nodes in your document.
- Select each node in turn and set its "Node Type" property value such that you have one node for each of the values "START", "DECISION", "PROCESS", "DISPLAY", and "TERMINATOR".
- Open the properties mapper.
- Create a configuration for mapping "Node Type" to the appropriate shape. It should suffice if your change the "Data Source" in your "Source Node Type" configuration from "Source Node Type" to "Node Type".
- Test your configuration.
- Remove the "Target Node Type" and "Decision Response" configurations.
With that done, restructure your spreadsheet like this.
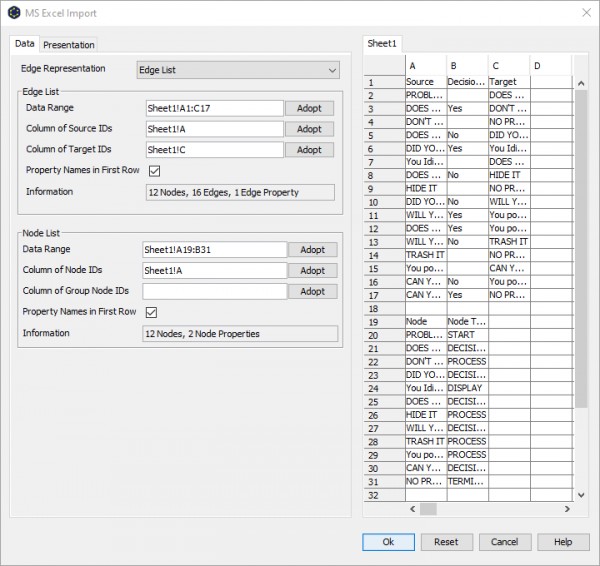
Now import the restructured spreadsheet, but this time specify data ranges for both "Edge List" and "Node List":
On the "Presentation" tab of the Excel Import Settings, go to the "Nodes" section, set "Label Text" to "Node" and enable "Fit Size to Label". In the "Edges" section, set "Label Text" to "Decision Response".
I suggest to set "Layout" to "Hierarchic" as well even though that is not strictly necessary since you want to run the Flowchart layout algorithm later on anyways.
Now, click "Ok".
The resulting diagram should again have noes with default shapes. However, if you select a node, there should be a custom property called "Node Type" with an appropriate value.
Now run the properties mapper. This should get you the correct Flowchart shapes for your nodes.
Adjust the size of the non-rectangular nodes such that they contain their label text.
Finally, run the Flowchart layout algorithm.
