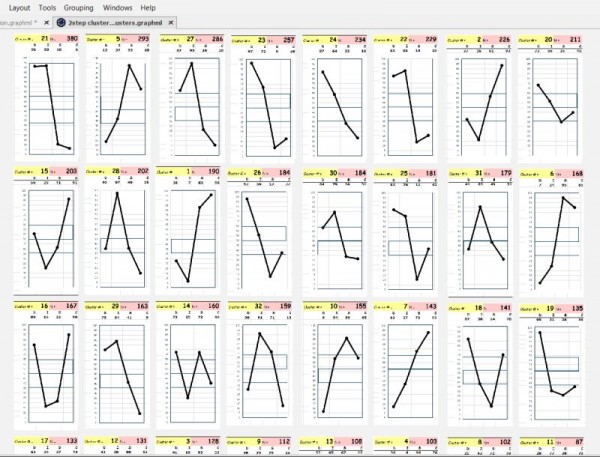
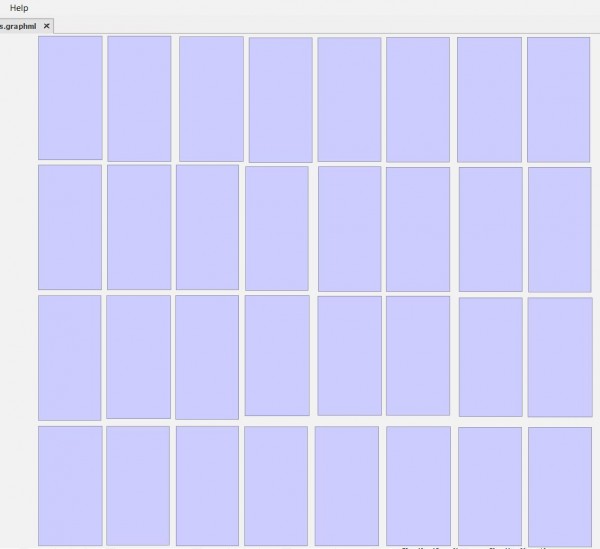
I've created a graph containing 32 images pasted into the graph. Each image is 328 x 643, and the images are squeezed close together in 4 rows and 8 columns. My intention was to manually rearrange the 32 images in various ways. However, when I attempt to zoom out to view the entire graph, all the images become plain blue rectanges with no details, making it impossible to tell them apart.
I'm using yEd 3.23.2 on a 64-bit Windows 10 machine.
The attached images show the graph before and after clicking "Show entire graph"

