Would you mind telling us what exactly you find to be "incomprehensible" in the yEd manual? Maybe we can improve those parts.
That said, I would like to point that yEd is a general-purpose graph editor, not a dedicated family tree or genealogy tool. (It just so happens that yEd has some niche features for family trees as well.) Moreover, you were trying to combine the most advanced and complicated features yEd has to offer. That is like trying to recreate the UNIX operating system on your first day as a programmer.
Anyways, let me try to explain the concepts involved in your task. Essentially, there are two steps to your task:
- Creating the diagram structure for your family tree.
- Arranging the diagram with a suitable layout algorithm.
Let me start by explaining step two in more detail first, because its requirements will affect what needs to be done in step one.
The main input for layout algorithms is the structure of your graph, i.e. how many nodes (in a family tree that would be the individuals and the families) are there and which of those are connected by edges. Together with the size of the nodes, this is all the input needed for most algorithms. For the family tree layout algorithm, this is not quite enough, though. In addition to the aforementioned information, this algorithm also needs to know which nodes are males, which are females, and which are families. For reasons that are beyond the scope of this answer, the family tree algorithm uses the fill color of nodes to identify males, females, and families. Moreover, it does not matter what colors you use, as long as you use three different colors and you properly specify those colors in the family tree settings. So, this
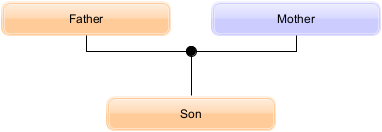
is a valid family tree for the algorithm's default color. As is this example
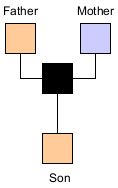
But so is this one
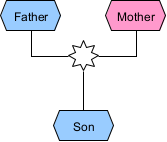
if the colors #ffffff, #99ccff, and #ff99cc are specified in the algorithm settings like so
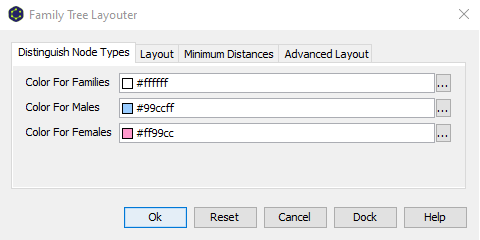
Moreover, the family tree algorithm also imposes restrictions on the structure of the diagram:
- There has to be an edge from the father node to the family node.
- There has to be an edge from the mother node to the family node.
- There has to be an edge from the family node to each of the child nodes.
I.e. the direction of the edges matter.
That is it for step two.
Now let me explain step one.
The most obvious way to create a diagram that satisfies the above requirements is by manually creating such a graph in yEd:
- Drag the desired nodes from yEd's palette into its editor area,
- edit the labels of the nodes that represent individuals to show the corresponding names, and
- use the mouse to connect the individuals to the appropriate family nodes.
While creating diagrams this way is yEd's main purpose (and a good way to get a feeling for how yEd works), doing so may take a long time for large diagrams. For this reason, yEd offers the possibility to import (large) data sets from external files.
One options is to import a GEDCOM file. GEDCOM is actually a file format specifically meant to store genealogy data. As a result, its data is already structured in a way that satisfies the requirements of yEd's family tree layout. And consequently, all you need to do in this case is to
- go to "File" -> "Open",
-
change the file filter to show files of type GEDCOM (i.e. files that end on ".ged")
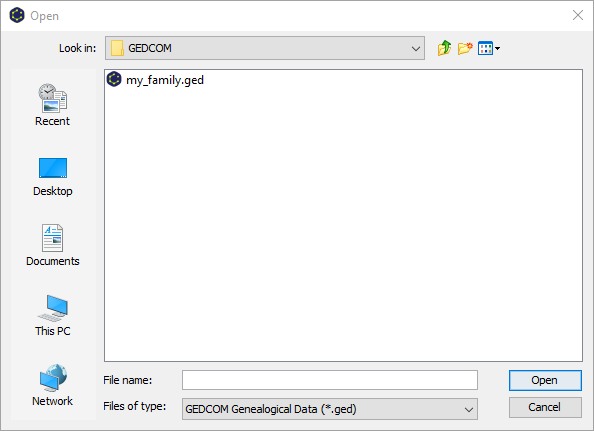
- click "Open", and
- click "Ok".
The GEDCOM import will create the necessary graph structure and automatically run the family tree layout for you.
The other option is yEd's general-purpose Excel file import. This is where it gets complicated. I have mentioned that yEd is a graph editor. This means yEd is intended for network-like data. Spreadsheets, on the other hand, are intended for tabular data. This is why you need to specify some "rules" on how to transform the tabular data in your spreadsheet into the network-like structure of a graph. How to do that is explained in chapter Import of Excel Files in the yEd Manual. Please note that it is not possible to import arbitrary tabular data. Your spreadsheet has to be organized in a way that lends itself to automated import as network-like data. yEd supports either adjacency matrices or node lists and edge lists. The node lists and edge lists representation is the more flexible of the two and thus the recommended way to organize your spreadsheet.
At this point you should probably go and create a couple of simple spreadsheets to play around with and get a feeling for yEd's Excel import. Do not concern yourself with how the imported nodes and edges look. Just try to understand how the rows and columns in your spreadsheet are represented as nodes and edges in yEd.
Start with spreadsheets that contain one column with node IDs, one column that specifies the IDs of the source nodes for the edges in the graph, one column that specifies the IDs of the target nodes for the edges in the graph, and nothing else.
Once that works, try adding further columns with auxiliary data and see how that auxiliary data is imported as custom properties for the nodes and edges.
And once that works, try to create a spreadsheet that results in a graph whose structure is appropriate for a family tree and whose nodes have custom properties for type (i.e. male, female, family), name, date of birth, date of death, etc.
By now you will have realized that all nodes and all edges created by Excel import look the same. Since the family tree uses the fill color of nodes to distinguish between males, females, and families, you need to set appropriate colors next.
yEd offers a manual and a semi-automated way to do that.
The manual way would be to use "Tools" -> "Select Elements" to select all male nodes, set the appropriate fill color (and change whatever other visual features need changing), then select all female nodes, set the fill color for females, and finally select all family nodes, and set the fill color for families.
The semi-automated way is to use yEd's properties mapper. However, to be able to set up the properties mapper, you will have to have succeeded in importing auxiliary data as custom properties first. I.e. there has to be a custom property for nodes that determines the type (male, female, family) of each node. Otherwise, you cannot create a property mapping that changes your nodes depending on the value of said custom property.
Similar to Excel import above, you should go and play around with the properties mapper now.
Start simple, do not use Excel import, but create a simple graph manually. Create two nodes, add a custom property of type "Text" for nodes (see "Edit" -> "Manage Custom Properties"), and set two different values for your nodes. (To do that, select first one node, then the other node. You can set the value for a custom property in yEd's properties dialog or in the properties view in the lower right corner.) Now go to the properties mapper and create a mapping that sets the fill color of your nodes depending on the property values.
Once that works, expand the example to at least three nodes with different values.
Once that works, try changing your mapping to set multiple templates instead of the fill color.
Once that works, add some additional properties and enhance your mapping with additional conversions that e.g. map the values of your additional properties to label texts.
Note, to be able to run the family tree layout algorithm on your graph, you do not need to use a template mapping. A property-value-to-fill-color mapping as proposed in the first step of the exercise will do. However, a template mapping lets you change the whole style of a node (or an edge) which in turn will let you change the shape of a node (for example). So, you will need to use a template mapping if you want to have circular family nodes and rectangular male/female nodes.
Phew, this got way longer than I thought it would. Hope it helps.