Custom properties are a flexible means for storing
additional data with the elements of a graph. By default, however, they are not visible in the diagram. The
Properties Mapper dialog lets you change the visible properties of the nodes and edges in a graph according
to their custom properties.
As a simple example, you can map text stored in a custom node property (“My Node Text Property”)
to the label text of the corresponding nodes. But it is also possible to turn integral values of a custom
property into different colors for nodes.
You can open the Properties Mapper dialog by selecting the menu entry Edit >> Properties Mapper…
Concepts
The Properties Mapper lets you define mappings that describe how to turn (values of) custom properties into (values of) visual properties of the nodes and edges of a graph. The visual properties cover nearly all properties that can be seen in the Properties View tool window of a graph element.
Mappings are part of configurations, which can contain virtually any number of mappings. Changing the
visual properties according to a configuration is called applying the configuration in the
following.
Applying a configuration is a one-time change of the diagram like adding a node or changing a label. It is
possible to undo the Apply configuration action.
Configurations
A configuration is a set of mappings either for the nodes or for the edges of a graph. All available
configurations are listed on the left of the Properties Mapper dialog and are appropriately marked as
applying to nodes or edges.
If you select a configuration from the list, the mappings of the configuration are displayed in the
Mappings table in the middle of the dialog.
Creating a Configuration
To create a new configuration for nodes or for edges, click the plus icon over the Configurations list in the top left corner of the Properties Mapper dialog and select the corresponding option. In the Name text field in the Selected Configuration section you can assign a suitable name to your configuration.
Mappings
A mapping is always part of a configuration. It is defined by three parameters which are listed in the Mappings table in the middle of the dialog:
- a custom property in the Data Source column (for example, “My Node Text Property”),
- a visual property of a graph element type, specified in the Map To column (for example, “Fill Color”), and
- a Conversion
There are different kinds of conversions possible, which depend on the type of the custom property in Data Source (for example, number or text) and the visual property in Map To (see below).
Although a mapping uses (the values of) a single custom property, you may have several mappings in a configuration that the use same custom property, if you want to change different aspects of the presentation based on the same information.
Normally, a mapping only changes aspects of the current representation of a graph element, like the line color of an edge or the border color of a node, but not the node (edge) representation itself. A template mapping, in contrast, is a special mapping that is intended to do just this.
Template Mapping
A template mapping allows you to change the template for the visual representation of an element. A
configuration may have at most one template mapping.
Whether a configuration uses a template mapping or not can be specified by means of the radio buttons of the
Template option below the Name text field. The following options are available:
- None
- The configuration uses no template mapping, i.e., the current node (edge) representations are retained. All mappings that are defined as part of the configuration apply to the nodes (edges) of the diagram in the active editor window as they are. In other words, aspects of their current representation are changed, but not their representation itself.
- Single
- Add a template mapping to the configuration that unconditionally assigns one node (edge) representation to all nodes (edges) of the diagram in the active editor window. The node (edge) representation can be selected from a popup menu.
- Multiple
- Add a template mapping to the configuration with which different kinds of node (edge) representations can be assigned to the nodes (edges) of the diagram in the active editor window. The actual template for a given node (edge) is chosen based on a custom property.
Creating a Mapping
To create a mapping, click the plus icon to the right of the Mappings table. This creates a new row in the table that shows
- the first custom property of the diagram from the active editor in the Data Source column,
- “Label Text” as the visual property of the graph element in the Map To column, and
- “Automatic” in the Conversion column.
By choosing from a drop-down combo box which opens upon clicking in the corresponding cell, you can change each of these default values.
Creating a mapping is also shown in the example below.
Kinds of Conversions
The possible conversion types for a mapping depend on its Data Source and Map To parameters. The following kinds of conversions are available for suitable mappings:
- Automatic
-
The values of the custom property are assigned to the visual property. If the types of both custom
property and visual property match, this can be done without applying any conversion. Additionally, values
of custom properties of type “Text” that follow specific patterns are recognized and can be
appropriately converted.
Suitable, for example, to map a custom property of type “Text” to the “Label Text” visual property. Also recognizes hexadecimal-coded colors, like, e.g., “#a4feb000” (RGBA) or “#a4feb0” (RGB), or numbers, like “12”, which enables mapping “Text” to “Line Color” and “Font Size”, respectively. - Distinct Values
- Specific values of the custom property are mapped to specific values for the visual property. Each mapping of a specific value needs a dedicated entry in the Conversion Details table (see below).
- Ranges of Values
- Ranges of values of the custom property are mapped to specific values for the visual property. Each mapping of a range of values needs a dedicated entry in the Conversion Details table (see below).
- Linear Scaling
-
Only available for custom properties of type “Integer” or “Decimal” and suitable
visual properties, like, e.g., “Width”, but also “Fill Color”.
The values for the visual property are linearly interpolated from the values of the custom property. In the Conversion Details table (see below), lower and upper bounds for both custom property and visual property values need to be specified. - Regular Expression
-
Only available for custom properties of type “Text” and text-based visual properties, like
“Label Text”, “URL”, or “Tooltip”.
Replaces text from the custom property that matches a given regular expression with a given replacement text. In the Conversion Details table (see below), the regular expression and the replacement text need to be specified.
All but the “Automatic” kind of conversion need further definition, which you can carry out in the Conversion Details section that is below the Mappings section.
Refining a Mapping: Creating Conversion Details
In the Conversion Details section of the dialog you can define further details for specific conversion types, like “Distinct Values”, “Range of Values”, “Linear Scaling”, and “Regular Expression”.
First select the row in the Mappings table that contains the conversion for which you would like to
define further details.
The Conversion Details section adjusts according to the actual conversion type:
- If the conversion is a “Linear Scaling” kind, four input fields allow you to enter the lower and upper bounds for both custom property and visual property values.
-
If the conversion is a “Distinct Values” or “Ranges of Values” kind, you can
define further details by adding new entries to the
Conversion Details table.
To create a conversion detail, click the plus icon to the right of the Conversion Details table. A new row in the table allows you to enter both custom property and visual property values that are needed for the conversion detail. -
If the conversion is a “Regular Expression” kind, a “Pattern” input field for the
regular expression and a “Replacement” input field for the replacement text are available.
Please refer to Java’s Pattern documentation for a summary of supported regular-expression constructs.
In the replacement text, any occurance of$n,na number, denotes a reference to then-th capturing group and will be replaced by the group’s value. You can include a literal dollar sign in the replacement text by preceding it with a backslash (\$). Similarly, you can include a literal backslash by preceding it with a second backslash (\\).
Additionally, you can use the escape sequence\nto include a line break in the replacement text.
In the first two cases the values of the custom property can be chosen from a drop-down combo box (opens upon clicking in the input field/the table cell) that also allows you to edit presented values or enter new values.
Creating conversion details is also shown in the example below.
Label Number, Node Size Adjustment
If you map to a label property like “Label Text” or “Label Background Color”, you can additionally specify the number of the label with the Map To Label No. spinner, since a node or an edge may have several labels. Label 1 is the main node or edge label.
Additionally, if you map to a node label with internal “Placement”, you can automatically adjust the size of the node to the size of the label by enabling the Fit Node to Label check box.
Creating a Template Mapping
Click either the “Single” or the “Multiple” radio button to add a template mapping to your configuration. A new row is added at the top of the Mappings table which shows “Template” in its Map To column.
-
For a template mapping of kind “Single” you can open a popup menu by clicking the button with
the image next to the “Single” radio button. The popup menu allows you to choose a node (edge)
representation from all templates available in the palette. This representation is assigned to all nodes
(edges), if the configuration containing this template mapping is applied.
No further configurations are necessary. -
For a template mapping of kind “Multiple” you can first specify the custom property in the
Data Source column by choosing from a drop-down combo box (opens upon clicking in the cell).
Following, you can specify the kind of conversion in the Conversion column in a similar
manner.
In the Conversion Details table below the Mappings table, you can now define the actual mappings from values of your custom property to different node (edge) representations. The different templates for the visual representation of an element are displayed in the Template View list to the right.
Creating a template mapping is also shown in the example below.
Applying a Configuration
If you want to apply your mappings to the current diagram, press the Ok or Apply button. Both apply the currently selected configuration to the active diagram. Pressing the Ok button also closes the Properties Mapper dialog. You can undo the changes resulting from applying a configuration like any other change.
Miscellaneous
Synchronization with Custom Property Changes
The properties mapper is aware of new custom properties that are added to the current graph. You can open the Custom Properties dialog (Edit >> Manage Custom Properties…) in parallel to the Properties Mapper dialog. If you add a new property in the Custom Properties dialog you can immediately use it in the Properties Mapper dialog. If you change the active editor tab both the Custom Properties and the Properties Mapper dialog reflect that change.
Synchronization with the Active Document
The Properties Mapper dialog keeps mappings defined for custom properties which are not available in the current diagram. If you apply a configuration with mappings based on unavailable custom properties, they simply have no effect.
Example
Let’s have a look at an example to see how the Properties Mapper dialog can help you turn your custom
properties into visual properties of your graph elements.
Let’s start with the travel_durations.graphml graph from the Help menu (Help >> Example Graphs >> Custom Properties):
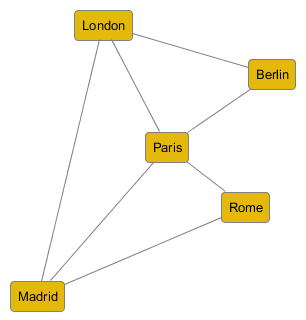
These are the custom edge properties defined in this graph:
- “Duration (minutes)”, of type “Integer”
- “Means of Travel”, of type “Text”
None of them is visible, however, i.e., we cannot see the values of these custom properties as annotated
with the edges. We will make them visible with the help of some mappings.
Open the Properties Mapper dialog (if not already open) and arrange it so that you can also see the example
graph.
1) Creating Configuration and Mappings
Let’s create a configuration for edges to hold these mappings. Click the plus icon over the Configurations list in the top left corner of the Properties Mapper dialog and select “Configuration for Edges”.
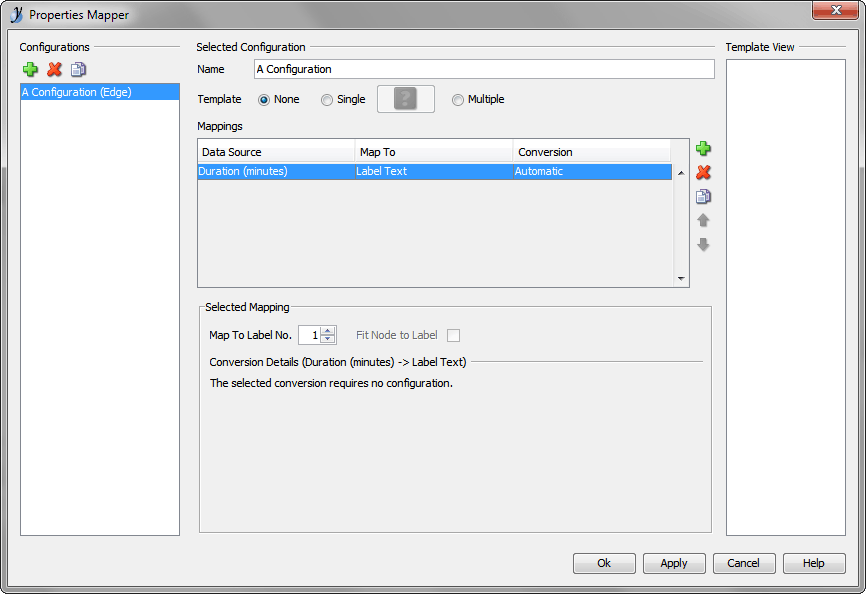
With the configuration ready, we can start creating mappings. Let’s start with an easy one. Click the plus icon to the right of the Mappings table in the middle of the dialog. This creates a new row in the table with three columns reading: “Duration (minutes)”, “Label Text”, “Automatic”.

This is in fact our first mapping. Click the “Apply” button at the bottom of the dialog and see what happens.
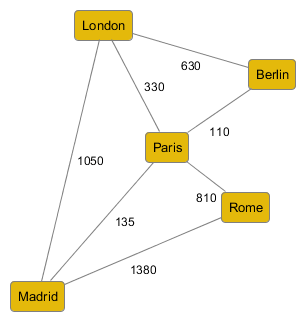
Great, we can see the travel durations between capitals in the diagram!
Let’s suppose (but only for a moment), we didn’t like the result of applying the configuration.
How can we go back? Click the “Undo” button in the yEd tool bar to return to the diagram before
the “Apply” action. It’s this easy to get to the previous state again.
2) Adding Conversion Details
Now let’s add a second mapping that also uses the “Duration (minutes)” custom property,
however, this time mapped to the “Line Width” visual property by means of a “Linear
Scaling” conversion. To specify these settings, you can use the drop-down combo boxes that open
upon
clicking into the respective table cells.
Note, however, that the “Linear Scaling” conversion will only be available in the drop-down
combo box in the third column after you have specified the “Line Width” visual property in the
second column! (This is because the conversion depends on the types of both the custom property and the
visual property that you choose. See also the description above.)
After choosing the “Linear Scaling” conversion in the third column, the
Conversion Details section below the Mappings table adjusts to show four input fields. The
two to the left are already filled, in the two to the right enter:
“1” (lower bound) and
“10” (upper bound).
This defines the details of our “Linear Scaling” conversion. Click the “Apply”
button to see how longer travel durations have turned into thicker edges.
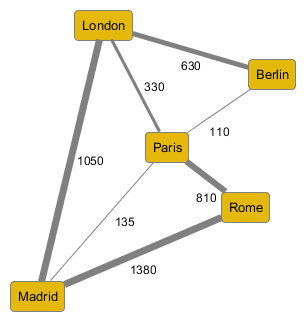
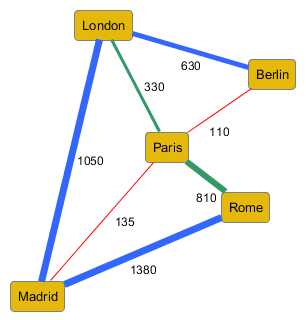
Looking at the diagram, it seems a good idea if we could also see the different means of travel more prominently, doesn’t it? Let’s realize this by adding a mapping where the “Means of Travel” custom property is mapped to the “Line Color” visual property by means of a “Ranges of Values” conversion.
With this third row in the table still selected, we can create conversion details in the
Conversion Details table below the Mappings table: click the plus icon to the right of the
Conversion Details table three times. This creates three new rows in the table, each with a color
chooser control in the second column.
For each of the rows choose another “Means of Travel” value from the drop-down combo box, for
example:
“Car”
“Plane”
“Train”
and assign three colors of your liking.
Click the “Apply” button to get something along this:
3) Creating a Template Mapping
As a last step in this example, let’s create a template mapping. The template mapping can be used to
change the template for the visual representation of edges.
Click the “Multiple” radio button below the Name text field at the top of the dialog.
This adds a new row at the top of the Mappings table. Choose the “Means of Travel”
custom property in the first column and the “Distinct Values” conversion in the last column of
the row.
With the row in the table still selected, add a conversion detail in the
Conversion Details table with the value “Car” in the first column. Then, in the second
column, choose from the popup menu the Edge Types >> Arc as the new edge representation.
Now click the “Apply” button to see that “Car” edges are represented by arc edges
instead of polyline edges.
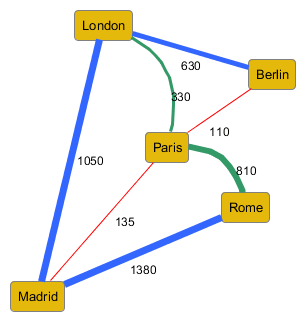
In this example we have created and applied a configuration for edges with several mappings. Creating a configuration for nodes is very similar.
