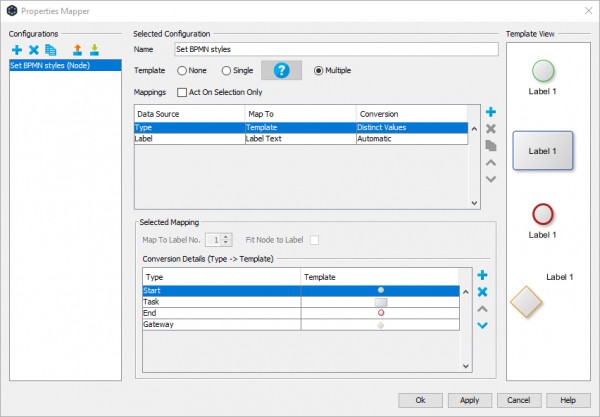
You need to combine yEd's properties mapper with yEd's Excel Import to import a BPMN diagram from a spreadsheet.
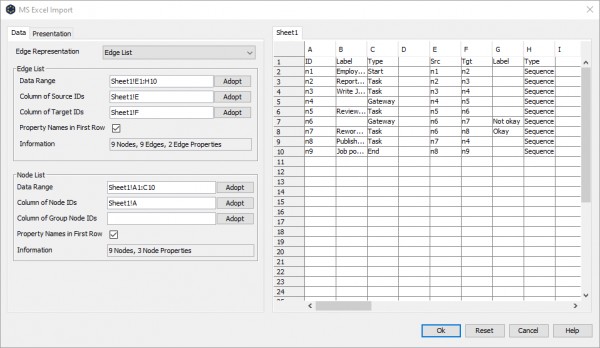
Your spreadsheet should have one row for each node in the diagram and one row for each edge in the diagram. The rows for nodes need to have at least two columns, one with a unique ID and one that determines the BPMN type of that node. The rows for edges should have at least three columns, one with the ID of the source node, one with the ID of the target node, and one that determines the BPMN type of that edge.
When importing such a spreadsheet, the columns with the BPMN type data will be imported as custom properties.
Once you have imported a spreadsheet with BPMN type data, use the properties mapper to change the style of each node and edge in your diagram to the appropriate BPMN style.
A simple example would be
(corresponding spreadsheet file)
with
(corresponding configurations file)
Note: This example has rows with data for nodes and edges for the sole purpose of using as little space in the screenshots as possible. You are free to put the respective data sets wherever you like, e.g. you can put node data in one worksheet and edge data in another worksheet. All the data has to be in one spreadsheet file, though.
