Welcome to yEd Q&A!
Here you can ask questions and receive answers from other members of the community and yEd developers. And you can tell us your most wanted feature requests.

Categories

Creating argument map automatically from a lawsuit (importing data from excel)

0 votes

In many countries, Common Law is practiced, which means past judgments are used as basis for disposing of new lawsuits. Therefore the lawyers must constantly study new court orders and apprehend the arguments.

First, they identify the past lawsuits by text search. But then they hit a wall: How to interpret the case, and apply to the new suit? The problem is, many lawsuits contain hundreds of logical statements.

The solution is to use an Argument Map: It is the best visual tool to break down a complex court order into logical statements and show how they interact.

And here, yEd can help, IMHO.

I have taken a complex case as a pilot case, and broken down the court order in simple logical statements, and marked each legal statement with a unique code.

Then I have identified their interaction (which statement supports or opposes another statement).

I have created an Argument Map manually.

But I wonder if there is a faster way:

Can yEd use the Excel data to create nodes having three labels, and then create edges between specific nodes?

If this can be done, yEd would probably revolutionize the legal profession!

I am posting below the typical excel chart, and the resulting Argument Map.

Step-1: Excel chart showing logical statementsLogic Table

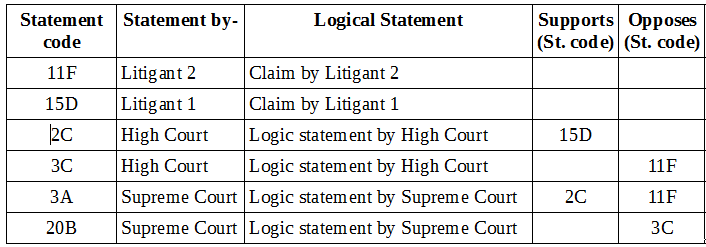
Step-2: Creating Argument map

Argument map

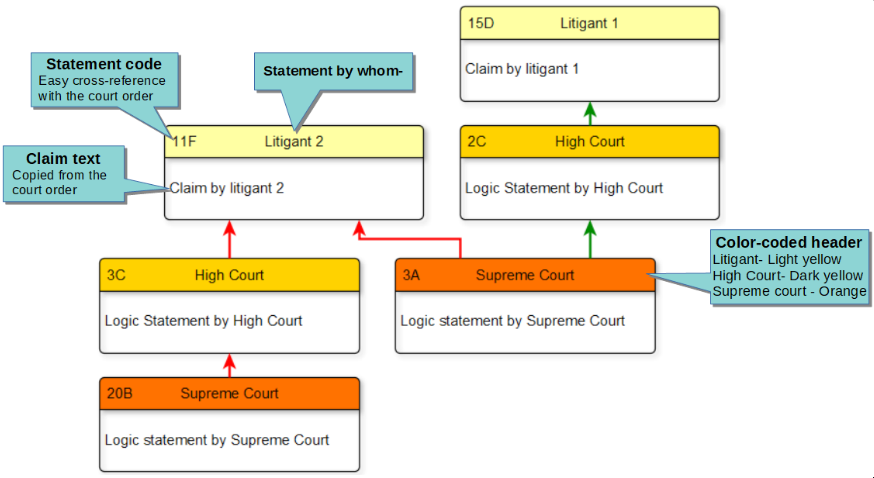
Note that I have added some visual features, such as-

  1. I color-coded the top compartment (header) for quick identification of the litigants, High Court and Supreme Court.
     
  2. I used a ER node (which has a header and a body), because it looks nice.

    But if yEd cannot handle it, I can always use a simple rectangular node (function is more important than form!)
in Feature Requests by (1.5k points)
edited by

1 Answer

0 votes
 
Best answer

Yes, it is possible to create such map from Excel data. However, you need to structure your data slightly different:

It does not matter if you have the Source/Target/Type information below the Statement information, to the right, or on the next sheet. The important point is that the node information has to be separate from the edge information.

The "Dummy" column is not strictly necessary but is used to automatically assign each node a fixed width and height.

When importing, also specify properties mapper configurations:

And finally, the corresponding properties mapper configurations.

by [yWorks] (160k points)
selected by
From the description, I gather that each node is supposed to have an ID.
But in our case, the values like 11F and 15D are the content of the label that is located at the left-top corner of the header compartment. It is not meant to be the node ID. (but it can be used for that purpose, since it is unique and associated with the node).

does each edge also have a unique ID? If yes, we have not specified it anywhere!

But the most important question is, how do I assign each column to a specific label in the node?

In my use case, there are three labels: Two in the header compartment and one in the body compartment. The content of each column must go to the corresponding label.

IINW these labels do not have unique names, which makes identification difficult.

So, if I add a few labels to the node, how do I identify each of them uniquely, and assign a column (field) of the excel data?

Secondly, how do I assign color-code to different types of edges?
(supports=green, opposes=red)
[I had entered a comment from a different PC, but it disappeared somehow. Re-entering the comment once again.]

As I understand, I have to make a template node first, in which I have to create the required number of labels and position them as desired, and this Excel will stuff all labels with text strings taken from specific columns.

For example, the first node would be created thus:
1. The content of Cell A2 goes to the top-left label, in the Header compartment.
2. The content of Cell B2 goes to the top label, in the Header compartment.
3. The content of Cell C2 goes to the label in the Body compartment.

So how does yEd understand this context without any inputs? I haven't identified the template node, nor have I told it which cell goes to which specific label!

Re:

From the description, I gather that each node is supposed to have an ID.
But in our case, the values like 11F and 15D are the content of the label that is located at the left-top corner of the header compartment. It is not meant to be the node ID. (but it can be used for that purpose, since it is unique and associated with the node).

does each edge also have a unique ID? If yes, we have not specified it anywhere!

yEd is an editor for network-like diagrams (i.e. graphs in the mathematical sense). As such, Excel import supports creating graphs as well. Since a graph means that there may be connections (i.e. edges) between nodes, there has to be a way to specify which nodes specifically should be connected. For this, there has to be a way to uniquely identify nodes. And since a node may be connected to multiple other nodes and there may be multiple connections between two specific nodes, it is not (easily) possible to encode the connection information in the node rows. Thus you need to specify a unique identifier for each node (and create a dedicated row for each edge).
There is no need for unique identifiers for edges because there is no secondary structure based on edges in a graph. Thus all additional information for edges may simply be put into the row that defines the edge.
Please see Import of Excel Files in the yEd Manual for documentation on Excel import.


Re:

But the most important question is, how do I assign each column to a specific label in the node?

This is done by yEd's properties mapper. Please read the documentation and inspect the sample configurations that are linked in the original answer.


Re:

As I understand, I have to make a template node first, in which I have to create the required number of labels and position them as desired, and this Excel will stuff all labels with text strings taken from specific columns.

For example, the first node would be created thus:
1. The content of Cell A2 goes to the top-left label, in the Header compartment.
2. The content of Cell B2 goes to the top label, in the Header compartment.
3. The content of Cell C2 goes to the label in the Body compartment.

So how does yEd understand this context without any inputs? I haven't identified the template node, nor have I told it which cell goes to which specific label!

Again, this is what yEd's properties mapper does.

Hi

I read (and re-read) the pages you indicated, but IMHO they are too complex for me. IINW this aspect is unique to yEd, and no other tool has this type of concept/GUI. Therefore the reader would not have any prior experience.

His learning curve should be made easier by providing a more elaborate help, with illustrated examples. I think a step-by-step video will help us tremendously.

(BTW I can make a series of videos and also an illustrated User manual, but for that I will have to work closely with a few developers, to clear my own doubts.)

Anyhow, I did my sincere best to proceed with the inputs available till now.

I created the xlsx file as shown in your first screenshot. I also downloaded the cnfx file you have made.

However, I got stuck a few times along the way, and could not complete the same step-by-step procedure on my own.

First, the help does not describe which menu allows us to import excel files. Since yEd has a "File>Export" menu, I expected a "File >Import" menu next to it. But this is missing. So finally I tried "File>Open" and it worked.

Next, I could not make out how to use the configuration file. I searched the online help and the bundled help file for "cnfx", but found nothing. So I had to skip this part.

There should be a demo video showing how to create this file and how to use it.

Next, I populated the "Data" tab without any difficulty. But I could not populate the "Presentation" tab. Please help how to fill this part of the dialog.

Thanks in advance!

The *.cnfx files from my answer are properties mapper configuration files. Thus they may be used with yEd's properties mapper. Go to "Edit" -> "Properties Mapper", then click on the "Import" button in the properties mapper dialog. The import button is the right-most button right below the "Configurations" heading. (All the buttons there come with tool tip text. Thus if you move the mouse over these buttons and do not move the mouse for a second or two, you will get a short description. The import button description says: "Imports additional configurations".)

Update:

Thanks to your latest tip, I could re-create the chart.

All edges of this chart had polyline routing. I tried to tweak the mapper to make both types of edges orthogonal. But it seemed to be impossible. Finally I selected the "Layout > Hierarchical" menu, and then switched to the "Edges" tab, and then changed the "Routing" drop-down menu to "Orthogonal".

I also got a taste of template-making.

To sum up, I can confirm that for newbies, a few video demos and/or step-by-step illustrated tutorials will do wonders. I can volunteer for this task. I have already made multiple user manuals, including one for LMMS.

[Sorry for cross-posting this here!]
Legal Disclosure | Privacy Policy
...