In many countries, Common Law is practiced, which means past judgments are used as basis for disposing of new lawsuits. Therefore the lawyers must constantly study new court orders and apprehend the arguments.
First, they identify the past lawsuits by text search. But then they hit a wall: How to interpret the case, and apply to the new suit? The problem is, many lawsuits contain hundreds of logical statements.
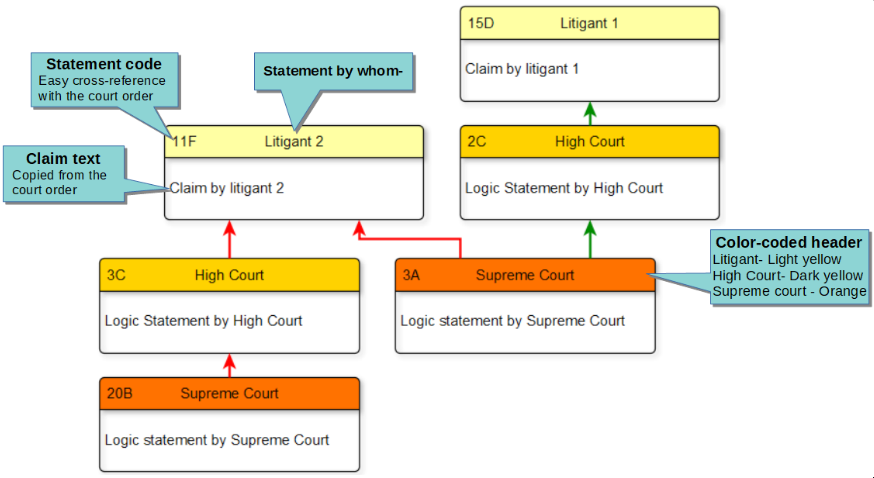
The solution is to use an Argument Map: It is the best visual tool to break down a complex court order into logical statements and show how they interact.
And here, yEd can help, IMHO.
I have taken a complex case as a pilot case, and broken down the court order in simple logical statements, and marked each legal statement with a unique code.
Then I have identified their interaction (which statement supports or opposes another statement).
I have created an Argument Map manually.
But I wonder if there is a faster way:
Can yEd use the Excel data to create nodes having three labels, and then create edges between specific nodes?
If this can be done, yEd would probably revolutionize the legal profession!
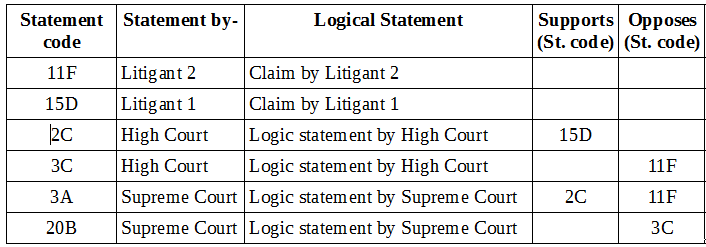
I am posting below the typical excel chart, and the resulting Argument Map.
Step-1: Excel chart showing logical statements
Step-2: Creating Argument map

Note that I have added some visual features, such as-
-
I color-coded the top compartment (header) for quick identification of the litigants, High Court and Supreme Court.
-
I used a ER node (which has a header and a body), because it looks nice.
But if yEd cannot handle it, I can always use a simple rectangular node (function is more important than form!)