Welcome to yEd Q&A!
Here you can ask questions and receive answers from other members of the community and yEd developers. And you can tell us your most wanted feature requests.

Categories

Complete Newbie > Importing A XLSX file from Touchgraph SEO (Google) > Workflow ?

+1 vote

Dear All, happy new year ! I am a (semi) complete newbie to yED. I'd like to perform the following:

Touchgraph SEO offers the possibility to study a relational network generated by querying Google on either terms or web sites. The following result is the structure of a file resulting from a basic search of the sites "related" to a specific photography critique web site. 

This is exported in CSV then converted into XLSX. yED can import that but them I am COMPLETELY lost and I need a STEP by STEP list of action to recreate the JAVA diagramme in yED. I have done some basic reading in the yED manual and understood that probably the issue lies essentially in the fact that the data exported by touchgraph do not include any means of representation 

If my analysis is correct, how can I "easily" add the adequate data in the excel below ? (I can see from the picture export of touchgraph, which page is connected to which page)

Can you help ???

Thanks in advance

Andrea

Search Term

Rank

Host

Url

Title

cphmag.com

1

cphmag.com

http://cphmag.com

Conscientious Photography Magazine


in Help by (130 points)
recategorized by

1 Answer

0 votes

If you import data from an Excel spreadsheet file, said spreadsheet needs to contain information on how to identify individual nodes (i.e. a column representing a node ID) as well as information on which nodes to connect (i.e. a column with the ID of source node and a column with the ID of the target node).

Unfortunately, the structure of the CSV file generated by Touchgraph SEO's "Export Data" action does not satisfy yEd's ID columns requirement.

In other words, after importing your CSV file into Excel, you need to modify your Excel spreadsheet if you want to import the data into yEd.

E.g. searching for "TFC Reutlingen" yields this diagram:
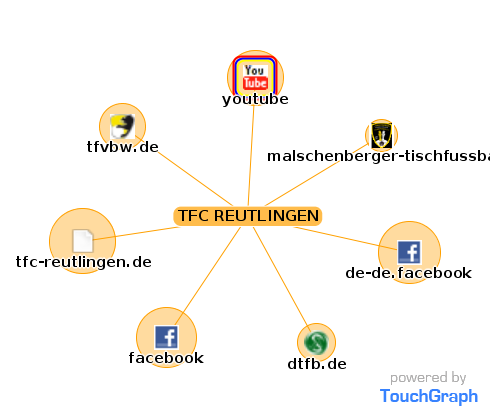
The "Export Data" action then results in this CSV data file.

This Excel spreadsheet is the result of importing the aforementioned CSV data file into Excel and augmenting the spreadsheet with additional information required by yEd.

Finally the following yEd Excel Import settings
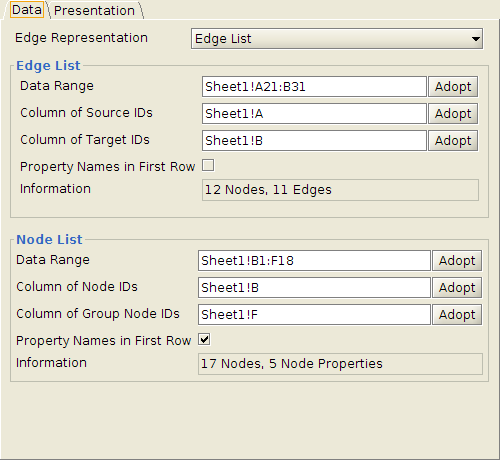
and
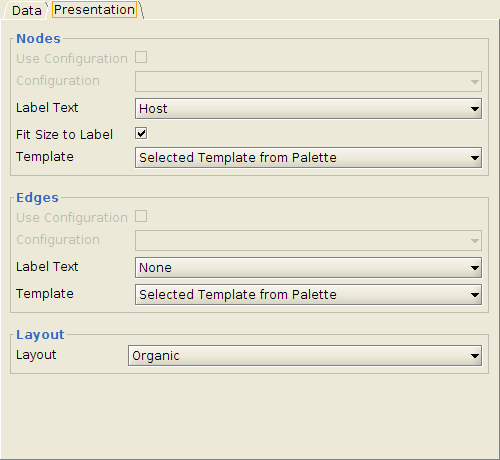
result in this yEd diagram:
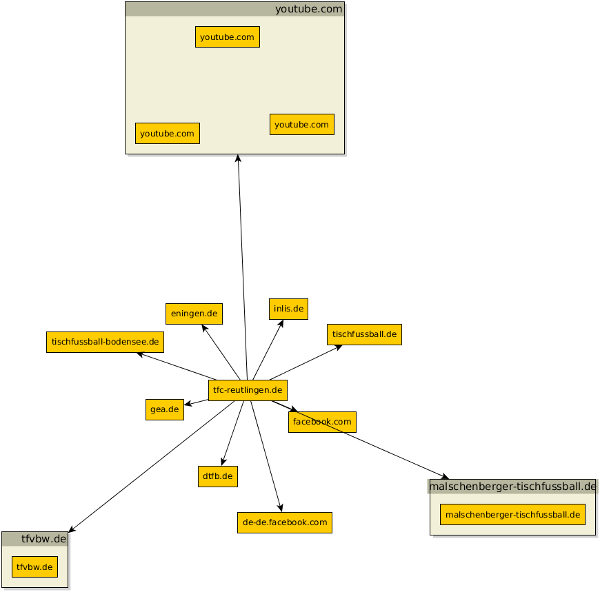
Corresponding GraphML file.

by [yWorks] (161k points)
Legal Disclosure | Privacy Policy
...