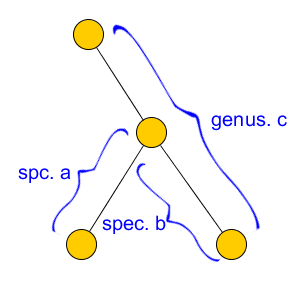
Here is a method that may produce what you want:
Get SVG files of left "{" and right "}" brackets. You can create your own with a tool like Inkscape or download free image files from openclipart.org or clker.com.
Import the shapes into yEd's palette. Add a new palette section for them if necessary.
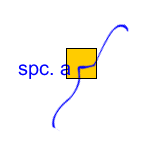
Create a new node on your graph. Any shape will do. Add the desired text in the desired color and size. Position the text label to the side of the node.

Next drag the appropriate left or right bracket shape from the palette to the diagram. Resize it to suit the graph, then position it over the node aligned with the text. Right-click on the bracket shape and select Convert to Label. This attaches the bracket to the node as a second label and keeps it together with the text label.
Now hold CTRL and click the bracket label until it is selected. In the properties for the label, enter a rotation angle to suit your graph, such as 320. This can be adjusted later if required.

Make the node invisible. Select the node shape and set the Fill Color and Line Color to No Color. Move the node into position beside the graph. Be careful to select the node itself and not the labels when moving it. For more, just copy the node and adjust the text and the rotation angle of the bracket.
