Welcome to yEd Q&A!
Here you can ask questions and receive answers from other members of the community and yEd developers. And you can tell us your most wanted feature requests.

Categories

Is it possible to make annotations to a node (and have them placed in order on the side of the graph)?

0 votes
Hey there.

I'm currently developing descriptions of processes within our company. The tool is a major help to make people understand what the process is about. Thanks for this. Now I'd like to have resposibilities added to the single steps of the process. Maybe you have seen this in professional (in terms of expensive) software. (Or in a DIY manner with MS Powerpoint).

It is like a collum on the right side where according to each node a person or group is assigned. Sometimes this is supported by a reffering number (linked to a specific node on the one hand and the corresponding person on the other).

Is this possible with yEd?


Cheers,

Christoph
in Help by (330 points)
edited by
Please upload an example screen shot or mockup that illustrates the desired feature.

3 Answers

0 votes
 
Best answer

Well, the desired arrangement is at least to some part supported by yEd's BPMN layout. However, for that to work, you need to use the appropriate nodes and edges from the BPMN palette as well.
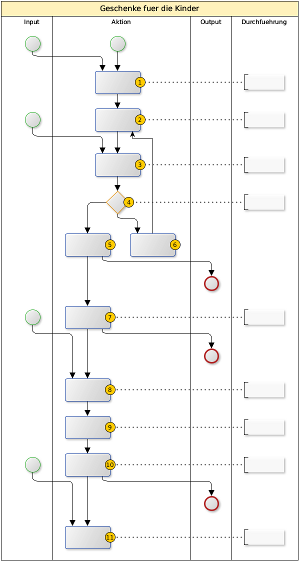
Sample graph.

The numbering was done manually by creating small circular nodes labeled "1" to "11" and converting these circles into node labels.

The arrangement was done semi-automatically. First, a complete BPMN layout was calculated (without the edge connecting node 6 to node 2). Then edge "6" to "2" was added, node "6" was moved to the right of node "5", the end nodes were moved below the respective task nodes, and finally a second BPMN layout with "Layout Mode" set to "Use Drawing as Sketch" was calculated.


BTW:
Ich drueck' die Daumen, dass sich die Probleme von 2011 nicht wiederholen. ;-)

by [yWorks] (160k points)
selected by
0 votes

Hey, in the meantime I joined the forum.

So this is what I would like the result to look like.

The numbering of the nodes was done manually in yEd. The reference is usefull when a few actions happen parallel (on the same level) and it gives the possibility to make further (more detailed) annotions later on. Where this feature is kind of luxurious. For me the possibility to assign resposibilities is much more important. 

So far I tried to simply add nodes to the 4th lane, but with no junction attached they are placed elsewhere everytime an automatic arrangement is performed.

by (330 points)
edited by
0 votes
I like the layout.

The benefit of the BPMN edges and nodes is some additional information that is taken into account for calculating the chart. I guess.

Nevertheless, I added the annotation nodes from BPMN section to my graph and this good enough for me. Obviously I just haven't thought on using a different node design to set the annotations apart from the main chart. Dotted lines help on this as well.

But I was definitly lost with the node label circles thing.

Now I found out that each node can carry more than one label [context menu -> add label] and that for each label the position can be defined differently. Each label can as well have a picture as background. So what is left to do is having the picture of a yellow circle ready (file format must allow transparency e.g *:png or *.gif) and choose it as background for one of the labels. Last thing is to arrange the label within the node [properties->label->position "internal, right"] and give it a little shift to the right (to have it centered on the outline of the node).

@thomas: if you change the position of the text within the symbol properties to "center" each, you can just change the text to a specific number and are free to change it as often as you want. Not being fixed to the pre-labeld circle is the result.

I think my pig whistles. It works.

Cheers, Christoph
by (330 points)
rofl @ "I think my pig whistles."

Converting a node into a label is done by moving one node over another node, right-clicking the moved node to open its context menu, and choosing "Convert to Label".

Aside from that, I suggest the following approach to ease your workflow even more:
1. Create a user defined palette section ("Edit" -> "Manage Palette").
2. Create one task node.
3. Set some dummy text for the default label.
4. Create a small circular node *without text*, convert it into a label for the task node, and configure the additional label as needed.
5. Remove the task's dummy text.
6. Right-click the task to open its context menu and choose "Add to Palette".
This way you get a nice template for your tasks that only requires the text to be filled in (for both labels).
(Steps 3 and 5 are required because "Convert to Label" will replace the default label if the default label has not been changed in some way.)
It's easy when you know how to do it.

I followed your suggestion and created my own nodes. This is, as I noticed, a nice way to change the presets of often used nodes. E.g. to have the text cropped by standard.

Btw: It helps to activate snap lines [F9] while arranging the comment nodes that I abuse for assigning the resposibilites. That way they can be perfectly on the same height as the corresponding task (and the edges stay where they are during calculation (no bows and detours))

This topic was going me animally on the cookie for a long time. ;-)
Thanks for the help.
Legal Disclosure | Privacy Policy
...