Welcome to yEd Q&A!
Here you can ask questions and receive answers from other members of the community and yEd developers. And you can tell us your most wanted feature requests.

Categories

Image information disappears when graph size reduced

0 votes

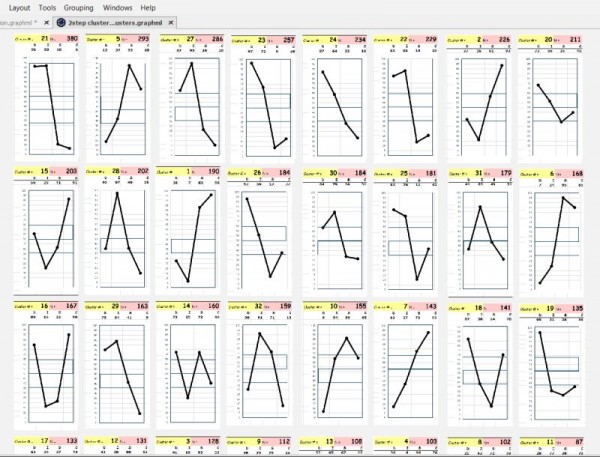
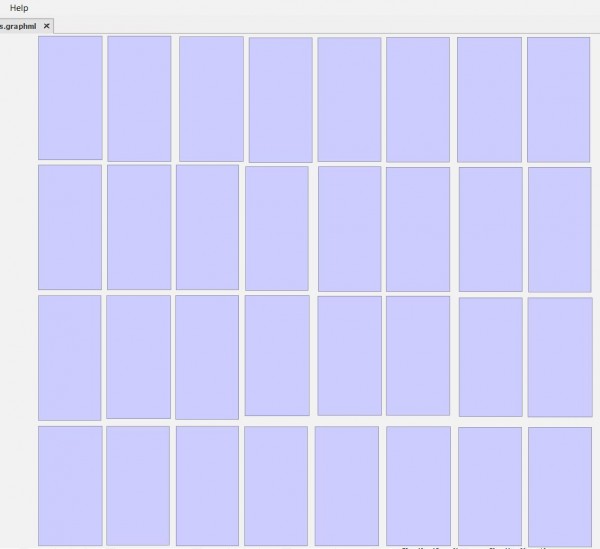
I've created a graph containing 32 images pasted into the graph.  Each image is 328 x 643, and the images are squeezed close together in 4 rows and 8 columns.  My intention was to manually rearrange the 32 images in various ways.  However, when I attempt to zoom out to view the entire graph, all the images become plain blue rectanges with no details, making it impossible to tell them apart.

I'm using yEd 3.23.2 on a 64-bit Windows 10 machine.

The attached images show the graph before and after clicking "Show entire graph"

in Help by (130 points)

1 Answer

+1 vote
yEd shows less details below a certain zoom level. The rationale being that you probably have lots of graph elements on screen for which you cannot recognize any details anymore. Thus the details will slow down rendering but provide no benefit.

Anyways, you can fine-tune this behavior (or turn it off altogether). Go to "File" -> "Preferences", tab "Display" and change the "Paint Details Threshold" value. The value is the zoom factor below which yEd will not show details anymore. A value of 0 ensures that yEd will always show details.
by [yWorks] (160k points)
Awesome!  Thanks so much.
Legal Disclosure | Privacy Policy
...